
With global efforts to achieve climate neutrality by 2050 gaining momentum, the pressure on companies to adapt and align with environmental protection policies such as RED II and EU ETS is increasing. And the complexities of the power grid, coupled with the need for precise power tracing and compliance, present significant challenges.
However, advanced technologies and innovative energy solutions are emerging as enablers in addressing these challenges. Leveraging our expertise in this domain, we were motivated to develop a comprehensive renewable energy mapping tool that uses AI to catalogue the power infrastructure, understand its technical specifications, and be able to assess the environmental impact. Now, let's explore how it all turned out.
Laying the foundation for ELEKS energy mapping solution
Our approach to building a power infrastructure map comprised of several key components:
- Use Object Detection Models to outline energy grid infrastructure using satellite images.
- Using LLM, trained with the help of different experts, to extract data from the internet.
- Connect both models to have a tool that allows you to do power flow tracing in the future or at least understand what plant has what output, what equipment is there, and who is managing it.
By integrating these three systems, we anticipated a comprehensive solution offering specialists an all-in-one-place view of the power grid.
- As we started with this project, we operated under several hypotheses that guided our initial steps:
-
- We assumed that we could get satellite images at such a high resolution to effectively train our system from both free and paid datasets, with a particular emphasis on the paid datasets since resolution could be a key factor in the future.
- We assumed that information about energy grid objects, particularly those related to high voltage, would be readily available online.
- We reckoned that our model could eventually be expanded to cover middle voltage systems, adding more data sources and models layer after layer.
Exploring the complexities of power grid data access
While many websites offer information about energy grid objects, the availability and quality of this data vary significantly. Some are well-maintained, like the ENTSO-e map, while others rely on community contributions, such as OSM-based solutions. However, none provide enough information to perform proper power tracing.
To fully implement our tool, we recognised we would need to reach DSOs and TSOs directly to get the needed data. And it creates an additional level of uncertainty, as not everyone wants to share their data, and even when they do, you still need to get a lot of paperwork done. Moreover, reaching out to providers doesn't always guarantee access to the required information since some data could be absent. Given that in EU countries like Germany, there are regulatory requirements to report extensively on the state of energy objects, much of this data should, in theory, be publicly available.
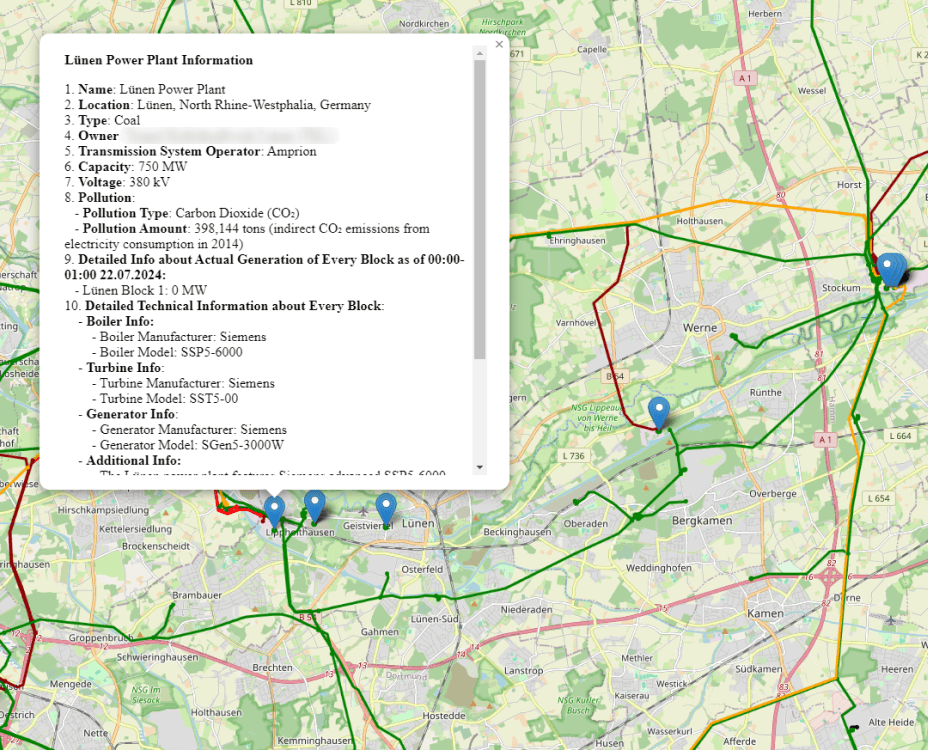
Taking everything into consideration, we were trying to create a system capable of gathering all needed data from the internet, validating results across multiple sources, and providing an all-you-need solution for power flow tracing, which become an increasingly requested service nowadays. The envisioned system would present data in a map format, making it easily accessible for engineers. After some prototyping, we came up with the following solution:
Power flow tracing and its role in optimising grid efficiency
ELEKS has extensive experience in the power and sustainability domains, which is highlighted by our involvement in projects like COVERE2, which aims to account for and verify greenhouse gas (GHG) emissions management in the agri-food sector. Our DAKAR product is a fully fledged power grid simulation software that also has a probabilistic functionality to model the flow of electrons on a grid, provided that certain technical grid specifications are known—power flow tracing. But what exactly is power flow tracing, and how does it relate to the problem we are trying to solve?
If you would like to understand your carbon footprint resulting from the power consumption, then you need to understand where your power is coming from – that is, where it is generated. Nuclear power has zero carbon emission, the same as wind or hydropower. Fossil fuels, like lignite, coal or gas however are carbon intensive. Incoming EU regulation requires companies to make their carbon footprint transparent. Currently, the draft regulation is content with national or regional fuel mix averages. DAKAR’s power flow tracing however will give you your accurate carbon footprint, depending on your location of grid connection.
To make power flow tracing operational, we need to know certain technical specifications of the power grid infrastructure and power generation data to feed it into DAKAR and pinpoint the carbon footprint for each and every connection point on a high voltage grid.
ELEKS energy mapping solution: methodology and architecture overview
Our approach centres on enabling the system to identify power infrastructures on the satellite images and cross reference technical data related to the specific item at a specific geolocation. It includes general information—name, location, transmission system operator, owner—and also real generation numbers, as well as specific technical details about the main components of the object alongside physical parameters.
However, the system doesn't completely cover the electrical grid. Some parts of the grid cannot be seen from the aerial images, for example, they are located underground or are hard to distinguish from other common objects. Thus, we shifted our focus during this project towards the high-voltage part of the grid.
We have used some of the open-labelled datasets for satellite images but also invested in getting some commercially available images. They can provide high-quality resolution images (0.3–0.5 m per pixel), which should be a game changer once we decide to go into middle voltage sometime in the future.
Overview of functional components
The system consists of two principally different functional parts: the object detection part, responsible for identifying energy objects, and the retrieval part, which gathers all information related to the object detected in the first part. Before jumping into the concrete implementation details and examples, let's discuss some theories behind those terms.
Object detection
Object detection involves localising the objects on an image and giving them corresponding labels (or classes). It combines two separate tasks: classification and localisation.
- Localisation in the context of object detection is the task of locating objects in the image. The results of localisation are bounding boxes around objects found in the image. Depending on the task, objects may be almost anything, starting from some natural objects, like trees, clouds, stars, or human-made houses, cars, and corn fields, ending with the skin cells on the microscope image. It really can be anything, and in our case, those objects are parts of the electricity grid: huge power plants of different types, power stations, substations, poles, solar panels, wind farms, etc.
- The task of classification is the subsequent task of labelling found objects. In reality, those steps are performed somewhat simultaneously than subsequently, using different parts of the neural network, but we will not focus on that for now. After object detection is done, we end up with the bounding boxes (rectangles) around detected objects and corresponding labels.
In our project, we leveraged the YOLOv8 architecture for object detection. We divided all energy objects into several classes, main of them are: power plant, solar panel farm, wind farm, substation, pole. For the training data, we made use of some commercially available satellite imagery and open-source data sets. The training process was iterative and quite complex; thus, it would not be covered here. Below you can see some examples of the final version of our finetuned YOLOv8:
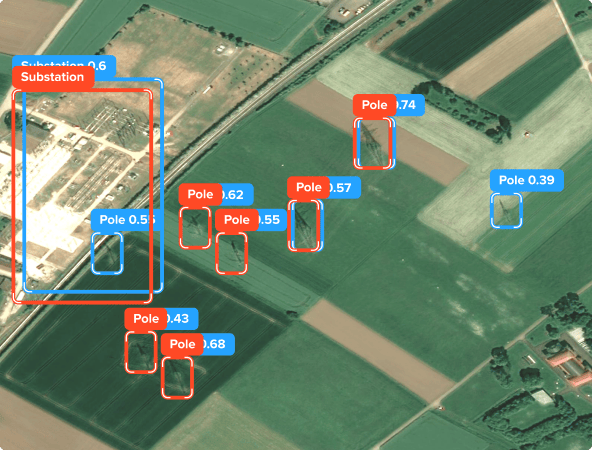
Detected objects in satellite image (red—ground truth, blue—prediction)
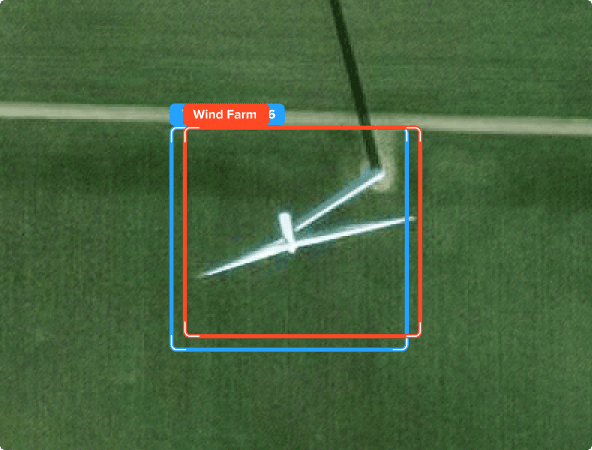
Detected wind farms in satellite image
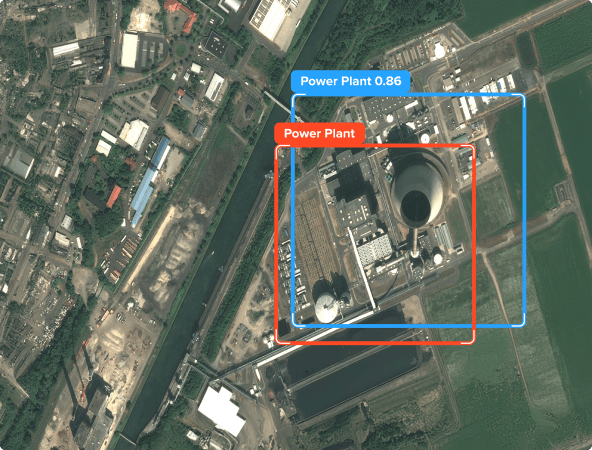
Detected power plant in satellite image
The detection is the first step in our pipeline, which gives us the coordinates of found objects alongside their class names. This information is fed up to the next part of our solution, data retrieval.
Data retrieval
Once we have the coordinates and type of the energy object we are interested in, we can proceed by finding the relevant data. Our search agent does this based on the ReAct prompting. But firstly, let's make everything clear with the idea of the agent itself.
The Agent is a system consisting of a large language model (LLM) and a set of tools that can be used to answer the question; in other words, it is a program that can answer users' questions. The LLM is a core component of the Agent. LLM is an artificial intelligence model capable of taking some input in text format and generating textual output. These are remarkable achievements in the development of artificial intelligence as they create a broader field of enhancing client-business communication capabilities (like chatbots, virtual assistants, and generation tools). However, the concept of an agent is more progressive.
The Agent differs from simple LLM because of its superstructure. The Agent can break down the given task into smaller subtasks and make correct small steps towards the final full answer. In other words, LLM can produce text output given some question or task, but it will fail in the case of a complex multistep task.
Additionally, the Agent can use the LLM knowledge—data used during the training procedure—and a set of tools, which may perform various actions and contribute to the final answer. It is the main difference between the two; the LLM can use its knowledge to answer certain questions, but it is often not enough, as questions may be too specific or relate to very recent events of which the LLM is unaware. In such cases, an additional source of information is needed. The Search Agent can look for missing information online and use the gained data to form an answer. It uses available tools that can perform various actions, starting from simple querying and ending with data extraction from concrete websites or databases.
- Key strength of the Agent as compared to the bare use of LLM:
-
- autonomy
- more advanced reasoning capabilities
- access to more data
- easily expandable
The only thing the Agent is worse at compared to the LLM is generating speed. The Agent often needs to perform several steps to get the desired answer and can thus be slower.
Now, let's get back to prompting—the process of designing prompts for effective communication with an LLM. Our Search Agent is based on ReAct prompting, a short form of Reasoning and Acting. During question answering, the agent makes verbal reasoning traces and then chooses the action needed to get the desired answer. The whole scheme can be described as a loop consisting of 3 steps: Thought, Action, and Observation. These steps are repeated until the answer is found.
Our implementation of a search agent is versatile and uses various strategies, such as simple search engine querying and data extraction from websites, databases, etc. The process of obtaining all needed data is quite complex and can be divided into several separate steps. The agent can decide by itself if additional actions are required in case of a challenging energy object. The results of the data retrieval step are displayed below.
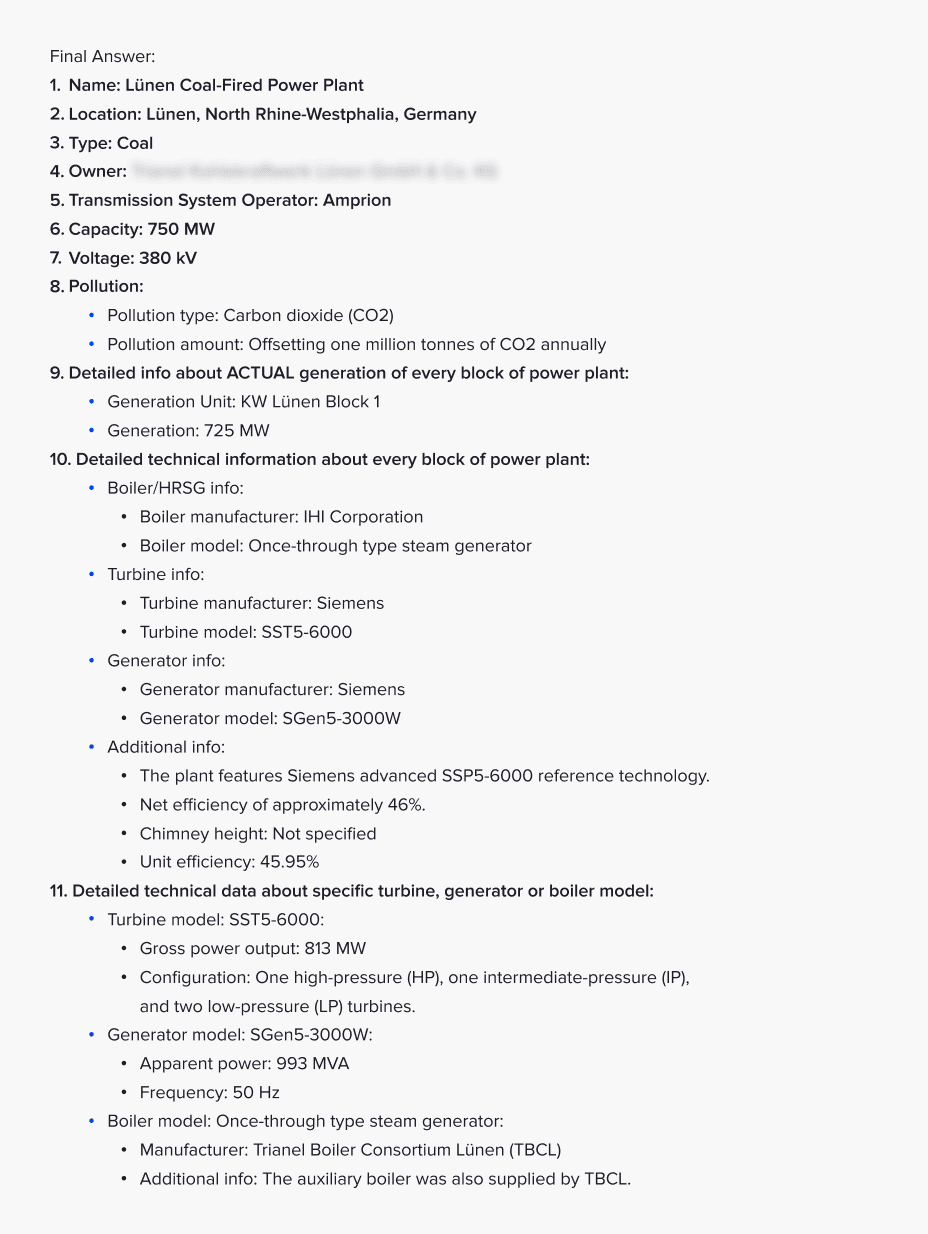
Power plant data retrieval results
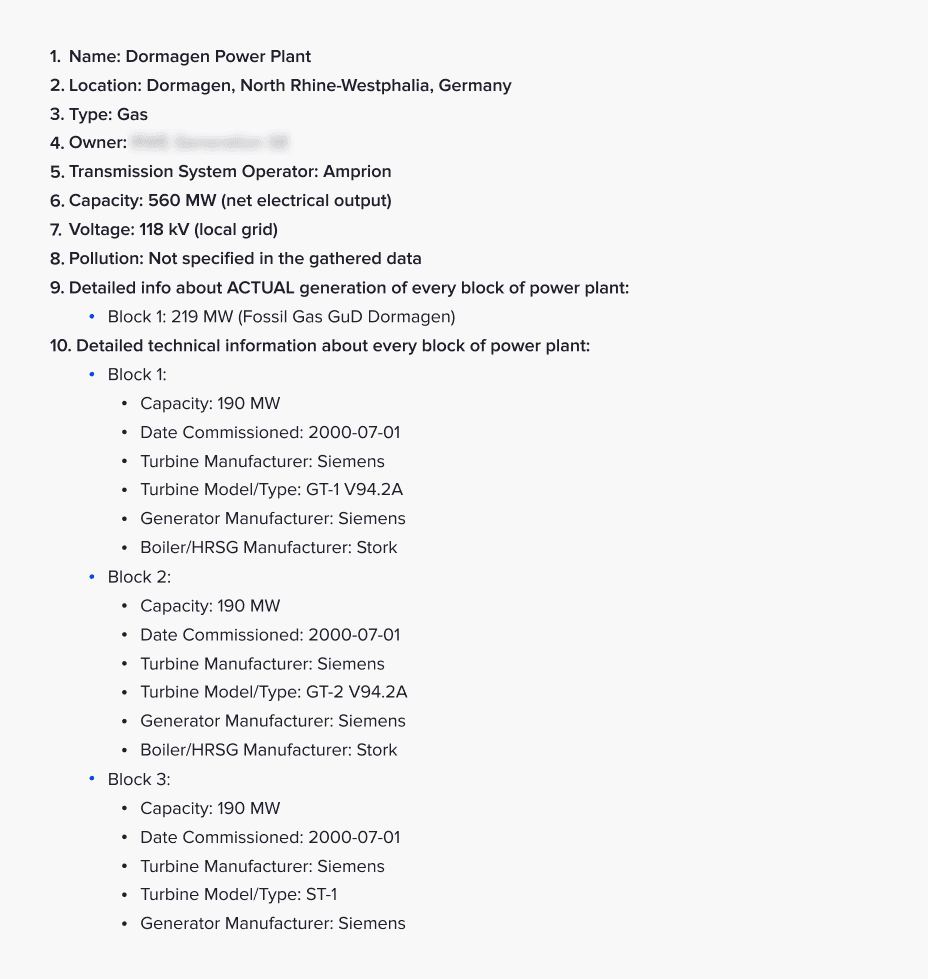
Power plant data retrieval results
Further steps
The mapping system described above is useful for a single image and can also be used with a set of satellite images to create an entire energy grid. In order to do this, the identified energy objects are connected via power lines (poles and cables) and data from the web. The map includes all energy objects, their actual generation amounts, and shows the current state of the energy grid.
Conclusions
After three months of dedicated work by our small team, we delivered a solution that addresses the key challenge for power flow tracing: data availability. The final system takes an image as an input, successfully finds the power grid objects using object detection models, and feeds the coordinates to the LLM, which uses guided and unguided approaches to dig up information from the internet. The model shows good results, with quite efficient metrics, proving that it is possible to enhance the quality of power tracing, at least on a high level. Our next steps involve extending the model to cover middle voltage systems and fulfil the power tracing requirements.
While the technologies we used, such as Object Detection and Large Language Models, are not entirely novel, our approach demonstrates the importance of collecting and connecting the available data. With a continued investment of time and resources, we are confident that we can achieve our goal of creating a comprehensive power infrastructure map at high and medium voltage levels—a vital tool that can accelerate the transition to clean, distributed power.

FAQs
Power infrastructure mapping is essential for understanding the layout and components of the energy grid. It assists businesses and energy providers in optimising grid efficiency, ensuring reliable power distribution, and complying with regulatory requirements. Accurate mapping also facilitates power flow tracing, which is crucial for calculating carbon footprints and achieving sustainability goals.
Power flow tracing allows companies to track the origin of the electricity they consume, distinguishing between renewable and non-renewable energy sources. By understanding where their power comes from, companies can make informed decisions to source more energy from low-carbon or renewable sources, thereby reducing their carbon footprint and meeting environmental compliance standards.
Related Insights


The breadth of knowledge and understanding that ELEKS has within its walls allows us to leverage that expertise to make superior deliverables for our customers. When you work with ELEKS, you are working with the top 1% of the aptitude and engineering excellence of the whole country.

Right from the start, we really liked ELEKS’ commitment and engagement. They came to us with their best people to try to understand our context, our business idea, and developed the first prototype with us. They were very professional and very customer oriented. I think, without ELEKS it probably would not have been possible to have such a successful product in such a short period of time.

ELEKS has been involved in the development of a number of our consumer-facing websites and mobile applications that allow our customers to easily track their shipments, get the information they need as well as stay in touch with us. We’ve appreciated the level of ELEKS’ expertise, responsiveness and attention to details.


