The efforts to highlight climate change need to span across the spectrum – from the loud and public, to the subtle and individual. Only by targeting the human instigators of climate change at every level does society stand a chance to get the climate change message across. Broadcasting the climate message requires a wide variety of tools too. We believe that data science can be one of these tools.
Whether the message is loud or subtle, digital approaches to climate change messaging are sure to have a big impact. After all, humans have increasingly digital lives. Technology has proven its ability to change the future of humanity for the better and simplified the way organizations around the globe carry out their sustainability management.
Interactive generative art – subtle but powerful
Why not take advantage of digital lifestyles when drawing attention to climate change? Everyone is familiar with weather forecast websites that use icons to simply and conveniently display the current and future weather. However, icons can’t represent dynamic weather features, wind for example.
That is why we thought about a “live window”, which shows the weather as it changes. We decided to make a web application that will display real weather conditions using natural landscapes created computationally, but artfully. In other words, with generative art.
It is a new approach to display weather conditions and by implication climate change which simplifies the perception of information by the viewer. This generative approach for weather art is based on an autonomous system that can make decisions by itself yet which is also limited by some predefined rules. The author defines rules and the system generates content. It is a real duo of human and machine which achieves impressive creative results.
Thanks to the generative approach the landscape is really special as it is always unique for the viewer, but at the same time, the placement of the key elements is the same. Every time the user accesses the application, the model creates custom graphic elements. A tree, sky, clouds, etc are all drawn from scratch using live weather data according to the viewer’s specific location.
Our primary goal was to introduce a creative and insightful way to show the impact that global climate change has on the landscape and the world around us. The screen can be split into two parts showing the same landscape, but with different weather according to past and current weather data. It could serve as a tangible example of climate change over the last 10 years, for example.
Also, this approach brings attention to the pressing question of deforestation. One can see evidently how long it takes to grow trees. Showing this data in this unique way generates a feeling of urgency which is always harder to do with plain numbers and statistics.
JavaScript is used for project realization and all visual elements are drawn using Canvas. The landscape consists of four main components: tree, ground, sky, and precipitation. That is enough to illustrate the seasons of the year plus the main weather conditions.
Tree
The central component of the virtual landscape is a tree, a convenient way to represent wind strength and the season of the year. The structure of the tree appears to be fractal, that's why it will be recursively generated, where each branch will have two child branches until a depth maximum is reached. Each final branch will have a leaf at its end.
An array of branches has to be generated, which is, in fact, an array of branch properties. Each branch should have its own tilt angle relative to the parent branch as well as a unique length, and colour, which is needed for leaves. The length for branches is chosen randomly, according to the depth of the tree and this is also the case for the tilt angle. However, the parent angle should be added or subtracted. So we will get two branches in different directions.
The tree crown is not homogeneous like a sphere, but rather сonsists of groups like a collection of spheres. As a result, the colours of leaves are different because some of them are more shaded and others are brighter. That’s why the tree crown is divided into groups, where each group is coloured from left to right side with a smoothed palette shifting from the brightest to the darkest colours.
Function divide(start,finish,intervalsAmount,n) divides the numerical interval between start and finish into an interval amount intervalsAmount and defines an interval that contains n.
const branchGroupDepth = 10;

const leavesGroupSize = 2 ** (branchGroupDepth-1);

let groupCounter = 0;

function generate(angle, depth, arr) {

let leafColor = colors[divide(0, leavesGroupSize, colors.length, groupCounter)];

arr.push({

angle,

branchArmLength: random(minBranchLenght, maxBranchLenght),

color: leafColor

});

if (depth === branchGroupDepth) { groupCounter = 0; }

if (depth === 0) { groupCounter++; }

if (depth != 0) {

if (depth > 1) {

generate(angle - random(minAngle, maxAngle), depth - 1, arr);

generate(angle + random(minAngle, maxAngle), depth - 1, arr);

} else {

generate(angle, depth - 1, arr);

}}}
The branch() function’s responsibility is to make the tree alive, so it recalculates branch coordinates every time the wind changes. Every branch is moving with a circular trajectory, where the start of the branch is denoted by the circle center and the branch length is denoted by the circle radius. The only thing we need to find is the coordinates of the branch end (which is also the start for the new branch).
- windSidewayForce — branch direction according to the wind direction
- bendabilityOfCurrentBranch — the coefficient of the branch incline under the wind depending on the branch thickness (or tree depth).
- calcX(angle, r)/calcY(angle, r) — functions that calculate the coordinates of the branch ends with r*cos(angle)/r*sin(angle) formulas.
let branchCounter = 0;

const bendability = 2;

const leafBendability = 17;

function branch(x1, y1, arr, depth, windConfig) {

if (depth != 0) {

const xx = calcX(dir, depth * branchArmLength);

const yy = calcY(dir, depth * branchArmLength);

const windSidewayForce = windX * yy - windY * xx;

const bendabiityOfCurrentBranch = (1 - (depth * 0.7) / (maxDepth * 0.7)) ** bendability;

dir = angle + wind * bendabiityOfCurrentBranch * windSidewayForce;

let x2 = x1 + calcX(dir, depth * branchArmLength);

let y2 = y1 + calcY(dir, depth * branchArmLength);

lines[depth].push([x1, y1, x2, y2]);

if (depth > 1) {

branch(x2, y2, arr, depth - 1, windConfig);

branch(x2, y2, arr, depth - 1, windConfig);

} else {

branch(x2, y2, arr, depth - 1, windConfig);

}

} else {

const leafAngle = angle + wind * windSidewayForce * leafBendability;

leaves[color].push([x1, y1, leafAngle]);

}

}
Tree branches are painted with a simple lineTo() canvas function, so each branch is a line. Leaves are painted with two Bezier curves using the bezierCurveTo() canvas function. Bezier curves consists of three points: start(blue), end(blue) and control(yellow). The last one makes a curve shape.
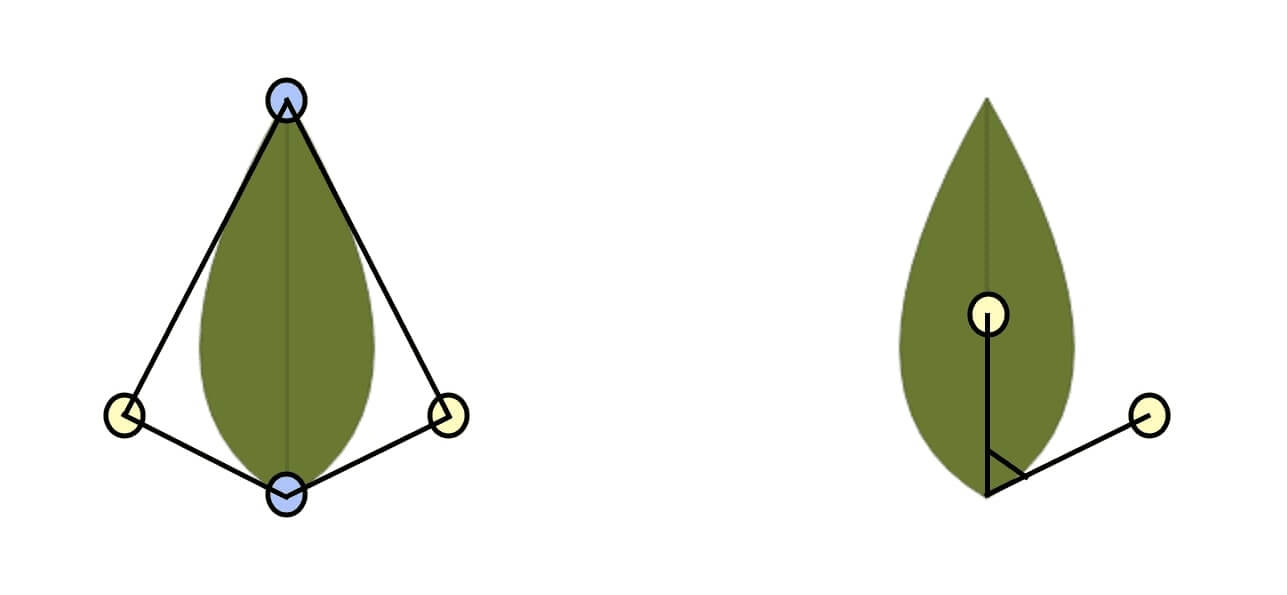
Painting tree leaves with two Bezier curves.
However, the canvas has a particular feature: you can’t paint several figures with different colors or strokes in a single path. So, all branches are grouped by their thickness and all leaves are grouped by their color. In order to speed up the rendering process, they are painted in groups. Also, the tree canvas is stored under a key (wind indicator) to improve render speeds. It means that the program doesn’t need to calculate every tree from scratch using the same wind indicator.
Ground
The ground (or rather, the grass) is no less important than the tree, grass can also represent wind and the seasons of the year. In order to generate grass, an array of piles is required. Each grass pile should have its own coordinates specifying a location in the field, reaction speed to the wind and an angle of incline relative to the ground. The closer grass piles should have saturated and contrasting colors and the more distant grass piles should appear smooth.
This visual trick gives an impression of a whole grass field. The field is divided into horizontal sections, each section has its own set of colors for piles. After array generation, it has to be sorted by the branch’s y coordinate to provide a range of grass piles that overlap – from the most distant, to the closest.
function generate(number) {

for (var i = 0; i < number; i++) {

var y = random(fieldTopStart, h + fieldBottomDeviation);

var x = random(0, w);

var colorGroup = divide(fieldTopStart, h + fieldBottomDeviation + 1, fieldAreas, y);

var color = colors[colorGroup][random(0, colors[colorGroup].length)];

var angle = random(-maxAngleDeviation, maxAngleDeviation);

var speed = random(minSpeed, maxSpeed);

dots.push([x, y, color, angle, speed]);

}

dots.sort()}
The grass pile is painted with two Bezier curves, just like we do with tree leaves. Also, grass piles react to the wind, bending in response. Coordinates of the pile’s endpoint and control points are recalculated according to the wind indicator.
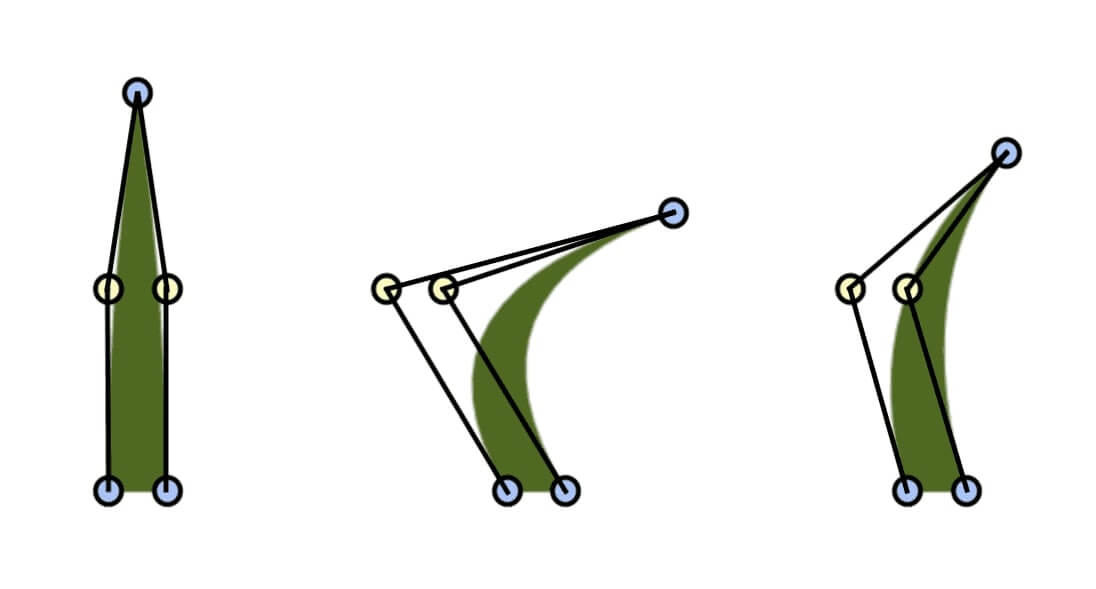
The grass pile is painted with two Bezier curves.
Sky and precipitation
Clouds and the number of clouds are the most important components of the sky. Clouds should differ in size relative to the position in the sky. So the sky is divided into horizontal sectors and higher sectors contain bigger clouds, which move faster.
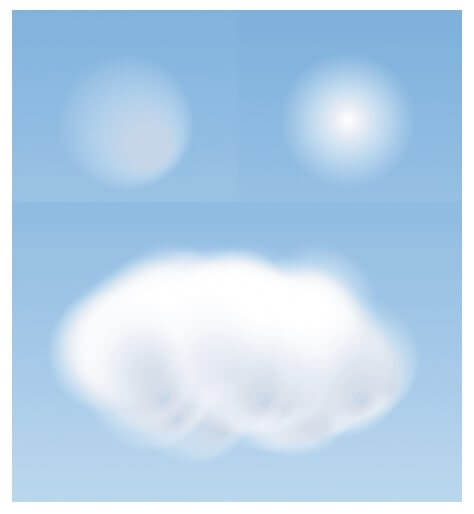
Clouds differ in size relative to the position in the sky.
Clouds consist of circles of two types. The first type is a gradient white circle with a gradient centre in the middle. These circles are distributed evenly on the whole cloud plane. The second type is a gradient grey circle with the bottom offset from its centre. These circles are placed in the bottom part of the cloud plane, so they make a cloud volumetric. However, clouds move not only along the sky but also inside themselves, causing the cloud shape to change. Each circle is dynamic, moving in circle trajectory with an individual centre.
Another important element of the sky is precipitation, including snow and rain. The raindrops are painted with a simple vertical line and its thickness depends on the rain’s heaviness. The snowflakes are painted with a gradient half-transparent circle. Every snowflake has a different size and the bigger it is, the more quickly the snowflake falls down. It creates the feeling that bigger snowflakes are placed closer to the user’s screen.
What does weather-based interactive generative art look like?
After some tweaks including colours for different seasons alongside the integration of live data we can now display the entire year through a “live window”.
Check out this youtube video to see how the things look like.
In addition to the weather forecast and a visual display of climate change over the years, our approach can also be used for making interactive backgrounds for natural museums or thematic exhibitions. This project idea can also be used in schools to make studying different climate zones more interesting.
Another useful aspect is that plant growth can be displayed in a “live window”. It would be interesting to see in action how many years certain plants require to grow to their full size. There is also the Beaufort scale of wind, which rates wind strength. One can show how strong winds affect trees, giving the user a realistic perception of wind strength.
This is only a demo for now. The model can be extended to adapt to a certain city by changing the type of the tree to suit the peculiarities of the local flora. Also, there are a lot of natural phenomena like fog, hurricane, lightning, tornado, and others that can be added. It may be a simple example: illustrating a change in weather using a data feed alongside a clever bit of coding. Yet the impact is significant – cognitively, our simple example moves viewers further along the journey of climate change awareness.
It all starts with a conversation and we encourage you to get in touch – to see how we can help address your unique challenges with a smart and creative technology solution.
By Mariana Mysak, R&D engineer at ELEKS
Related Insights






The breadth of knowledge and understanding that ELEKS has within its walls allows us to leverage that expertise to make superior deliverables for our customers. When you work with ELEKS, you are working with the top 1% of the aptitude and engineering excellence of the whole country.

Right from the start, we really liked ELEKS’ commitment and engagement. They came to us with their best people to try to understand our context, our business idea, and developed the first prototype with us. They were very professional and very customer oriented. I think, without ELEKS it probably would not have been possible to have such a successful product in such a short period of time.

ELEKS has been involved in the development of a number of our consumer-facing websites and mobile applications that allow our customers to easily track their shipments, get the information they need as well as stay in touch with us. We’ve appreciated the level of ELEKS’ expertise, responsiveness and attention to details.
