In today’s business world, data is the key to everything. Collected and analyzed in the right way, employee data can help organizations effectively map their human potential for their business needs, ensuring well-informed and sensible people decisions. The choice of the approach to data analysis depends on the objective as well as the data available. Since an absolute assessment of employees, their skills, experience or productivity may be too biased, comparative or similarity analysis methods can deliver better results in this case. These analytical methods provide comprehensive, equitable and comparable human data regarding the internal talent pool, the external labor market or the competitors’ human potential. This information not only allows one to conduct the descriptive analysis but also enables Data Scientists to make predictions and provide recommendations.
The talent-related challenges and needs that data science can help address through predictive workforce analytics are quite diverse and include such cases as defining skills gaps, finding the best fit for open positions, measuring managerial success and performance, etc. Let's have a closer look at each case from the point of an analytical approach and define the research methods that can be applied to get the most comprehensive results.
Identifying the Skills Gap and Analyzing its Cost for Organization
In human capital management, the skills gap can be interpreted as a deviation of the particular specialist and his professional characteristics from a benchmark or a certain standard for a particular position. This definition can be also applied to groups of people or departments. However, for the latter category, the skills gap can be determined only if there is a clear list of characteristics created for this particular group of people or in case of critical elements available in the intersection of feature sets for this department or group.
In general, the critical elements in the intersection of feature sets will be used to determine the differences in both cases, when either a person or a group is analyzed. In other words, we are identifying the largest intersection - the most frequent features of all the people in the group or department. As a result, we can form a corresponding center or standard for this department. This term can be graphically represented in the following way:
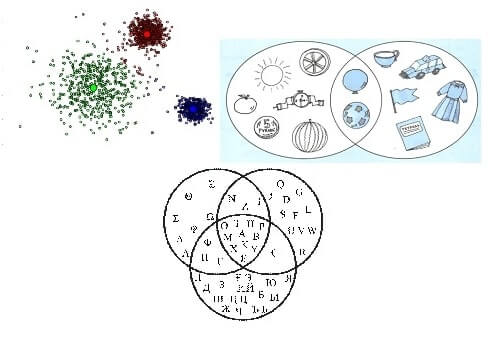
The first figure shows the possible critical elements in the intersection of the feature sets, the second and third - the intersections and the actual critical elements: the balloon and the ball, the OTHP letters and others. These critical elements can consist not only of certain skills but also of other "standards" relevant to the group, department or position. Such standards can include education, experience, age and even how long it takes for the person to get to work. The last characteristic may be important for the cases of urgency. In some cases, we may need to consider the vacation timeframes, for example, a certain person cannot take vacation during the most intensive workload periods.
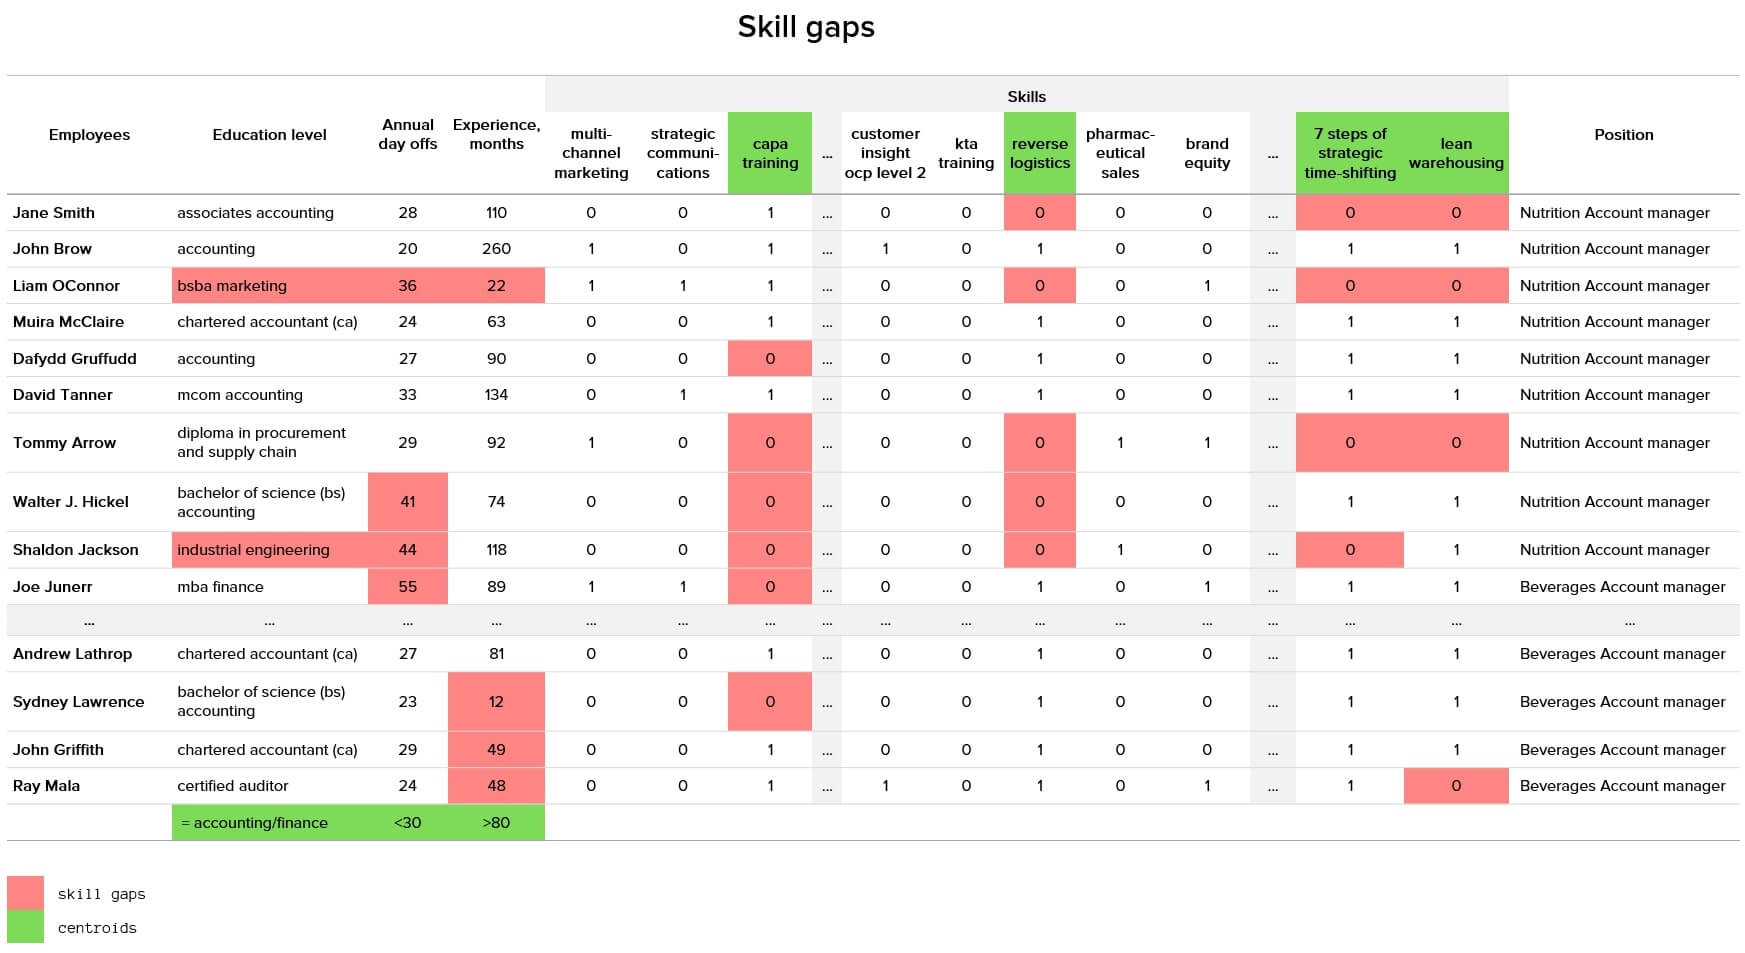
By defining the standard, we can evaluate each employee, distinguishing the deviation against the standard. These deviations will be the skills gap in our case.
The above table shows, highlighted in green, the centroid of features for Account Managers defined by four skills, as well as the education profile, the average number of leaves, being fewer than 30 days and the work experience - longer than 80 months. The deviations for these characteristics are highlighted in red.
As for the cost of the skills gap, it is the amount of money the organization loses because of the existing gap or the money that is spent to eliminate it. To calculate the cost of the gap closure, in other words, the money needed to educate people with the appropriate knowledge and skills, we need to have information about the system of education (LMS - Learning Management System) in the company or outside of it.
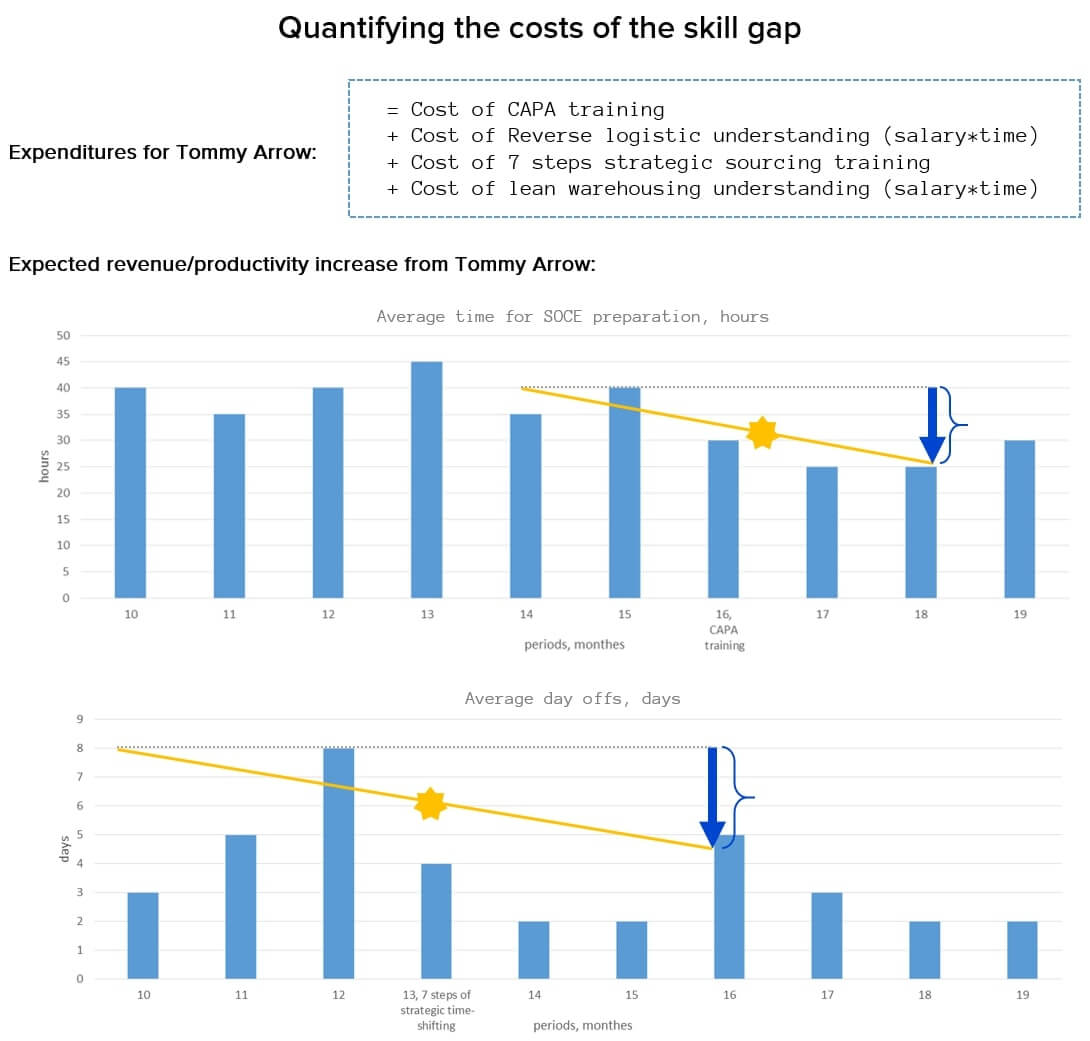
As to the expected results from acquiring certain features, the growth of productivity or, on the other hand, an increase in the salary associated with professional development, they can be defined by analysing the increase or changes before and after the feature (experience or education) is acquired. The figure below shows the increment associated with 4 new skills gained by the organization’s employees:
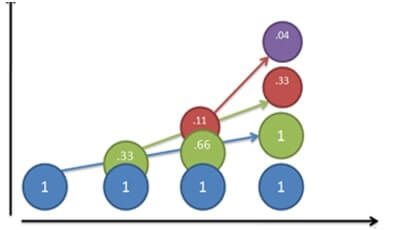
The expected increment is defined as an average (mode) based on the previous empirical information about the activity of the employees. All the value parameters in this case were discounted, as the value increments depend on the time value of money.
The above two examples show the possibility to predict the expected changes associated with the professional activities of the particular employee (Tommy Arrow), based on the indicators of the organization’s performance, collected over the years of its operation. Analysing the results, we can see that the time required for certain activities, report preparation, for example, can be reduced after the employees pass a number of relevant trainings or certifications.
Analysing Employee’s Performance and Productivity
In this case, first of all, we need to determine the parameters, or their combination, that would allow us to evaluate the quality of the employee’s work. Assuming that profit is the key purpose of any business, the task becomes much easier, especially when we know the revenue generated by a certain employee. However, in order to determine the revenue associated with the employee, we need to know the cost of his or her employment, retention, training, etc.
To ensure the unbiased results, we need to consider various aspects associated with the employee's work. For example, employees working in sales can perform better depending on their location. The employee operating in the top selling area can show better performance, spending less effort than employees from other locations.
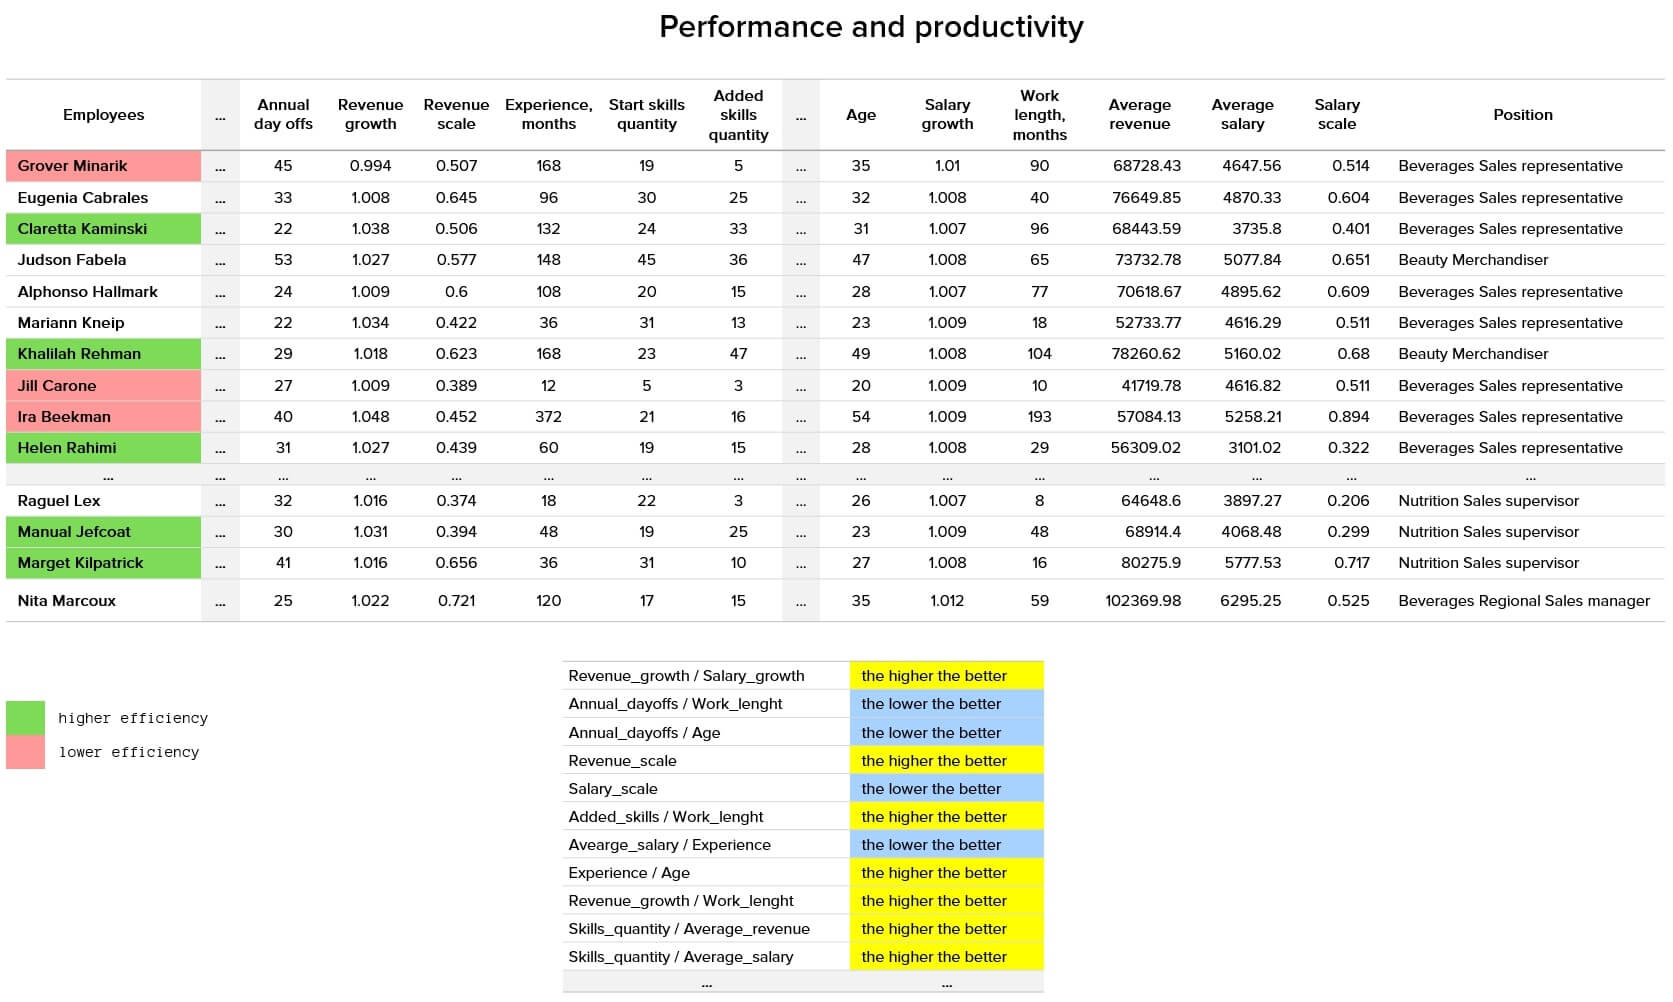
Another possible performance indicator is associated with the employee’s individual professional development. This is the coefficient of proportionality between a number of the certificates gained and the amount of working hours. The bigger the coefficient, the more promising the employee is.
The next one is the labor expenses indicator, being a proportional coefficient between the employee’s salary and experience. The bigger the coefficient is, the greater are the savings associated with the employee’s experience. Therefore, this employee can be considered less “expensive” than other similar workers, and thus this person brings a higher marginal utility for organization. Another important factor is the attendance indicator, being a proportional coefficient between the amount of leave and general working time. And the last one to mention here is the so-called rank of employee. This indicator can be based on the comparative analysis of the employee’s average income, proficiency level or other characteristics that are used to determine the top employees in the department.
Apparently, with a sufficient number of indicators we can build an aggregated or elevated indicator, allowing one to evaluate effectiveness, even for those employees that are not directly engaged in production and therefore do not generate revenue directly. Having determined the top (over-performers) and bottom (under-performers) fractals and separating them as classes, we can build a typical binary classifier. New employees and those that were not evaluated so far can be added into these two classes as going forward. If a classifier allows one to analyse the qualitative factors, taking into account the domain, or to identify the key differences in the classes of over- and under-performers, we would be able to define certain changes that could help improve the performance of employees.
Below, you can see a simple classifier presented in the form of a tree. In our research, we will be using a more complex one, with over 2000 features, allowing one to analyze the employee’s performance and expected salary, as well as predict a possible dismissal, determine a future career path, foresee potential professional development, etc.

Besides, to analyse the possible increments, we can provide certain forecasts or give recommendations based on the similarity of employees compared to over-performers etc. as shown on the picture below:
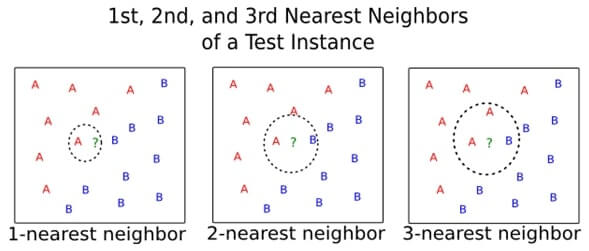
The 3rd picture shows that if 2 As in the circle are over-performers, a B from the circle will be most likely an over-performer as well.
The effectiveness of an employee can be determined considering not only the person’s direct income, but also the other performance indicators and their combinations, as shown in the table above. In this way, we can determine the specialists with the highest and lowest efficiency and even forecast the effectiveness of new employees.
Analytical Approach to Measuring Managerial Success
The performance of key managers is typically measured by the abovementioned evaluation method, complemented with additional managerial indicators: (number of subordinates, their efficiency and performance). Likewise, we determine the growth of the manager’s effectiveness initiated by acquiring a new skill or filling the skills gap. Based on the specific features, we can predict the managers’ probability of being fired, the minimum wage or the expected revenue generated by them. Therefore, all the proposed models can be easily adapted for a specific group of people or departments.
Finding the Best Fit for Open Positions
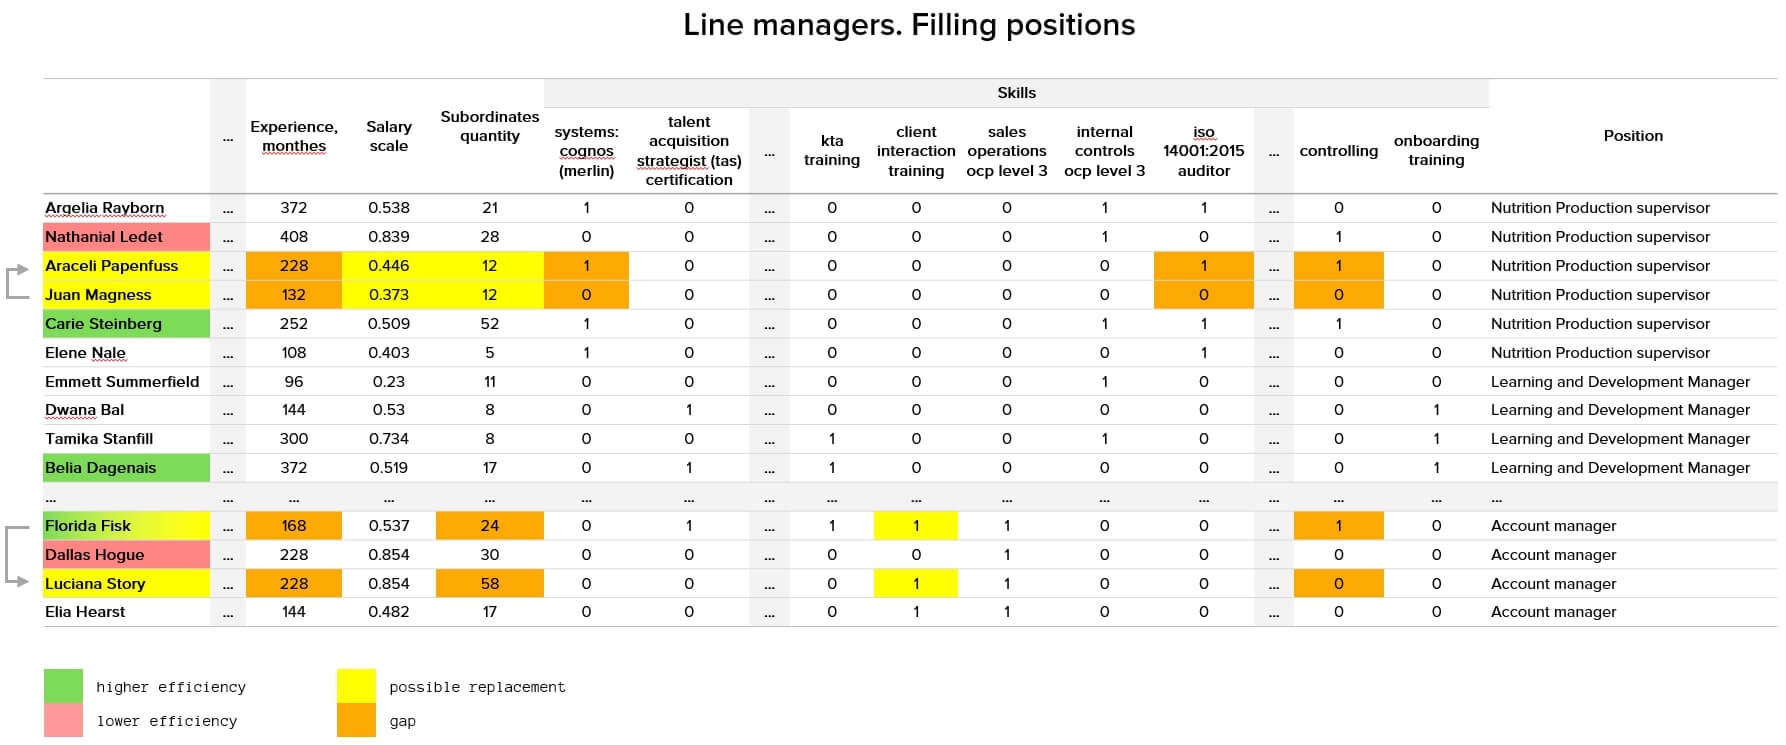
The recommendations for filling vacancies - through hiring from the employee market or through the promotion of existing employees - are mainly based on the concept of similarity and levels of resemblance according to different features. Determining and minimizing the difference function, we can identify the person that is the most suitable candidate for a certain position, and, as mentioned above, fill the skills gap. The similarities can be determined with the help of the abovementioned function or by using the methods of the nearest neighbors.
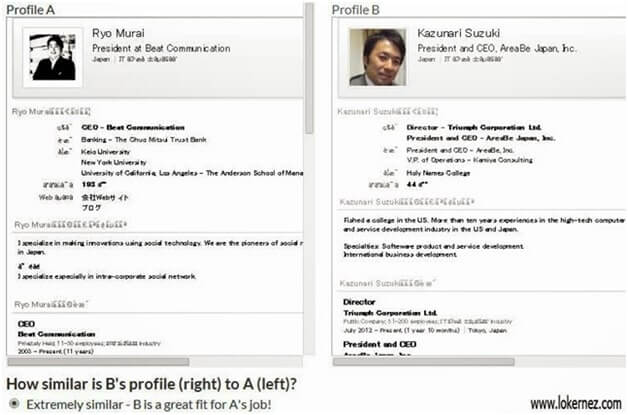
However, we need to determine the value of certain features first, as far as the proximity or difference between experience or performance are not equal and cannot be compared to the proximity of skills, since the absence of the skill has one certain unit of measurement while the difference in experience can be measured in years, etc.
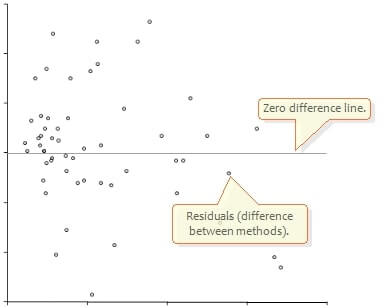
Therefore, the candidates can be sorted by proximity to a certain position. Here the most obvious factors are the risk of being dismissed or forecasted level of performance. A candidate with a high risk of dismissal and low performance forecasted should not be recommended. This way, we can determine the skills gap, recommend a salary level or predict the employee’s performance.
As you can see in the table above, first of all, we found the centroids for certain position, as shown in the first example. Then, we identified the most efficient and inefficient employees (green and red highlights). Using the similarity function, we found the employees with the lower position or salary as potential candidates for replacement (highlighted yellow). Having analyzed the difference between target employees and potential replacement candidates for these positions, we defined the skills gap. In other words, we determined the qualities the employee needs to obtain.
Defining Data Sources and Data Sets that Influence Workforce Productivity and Success
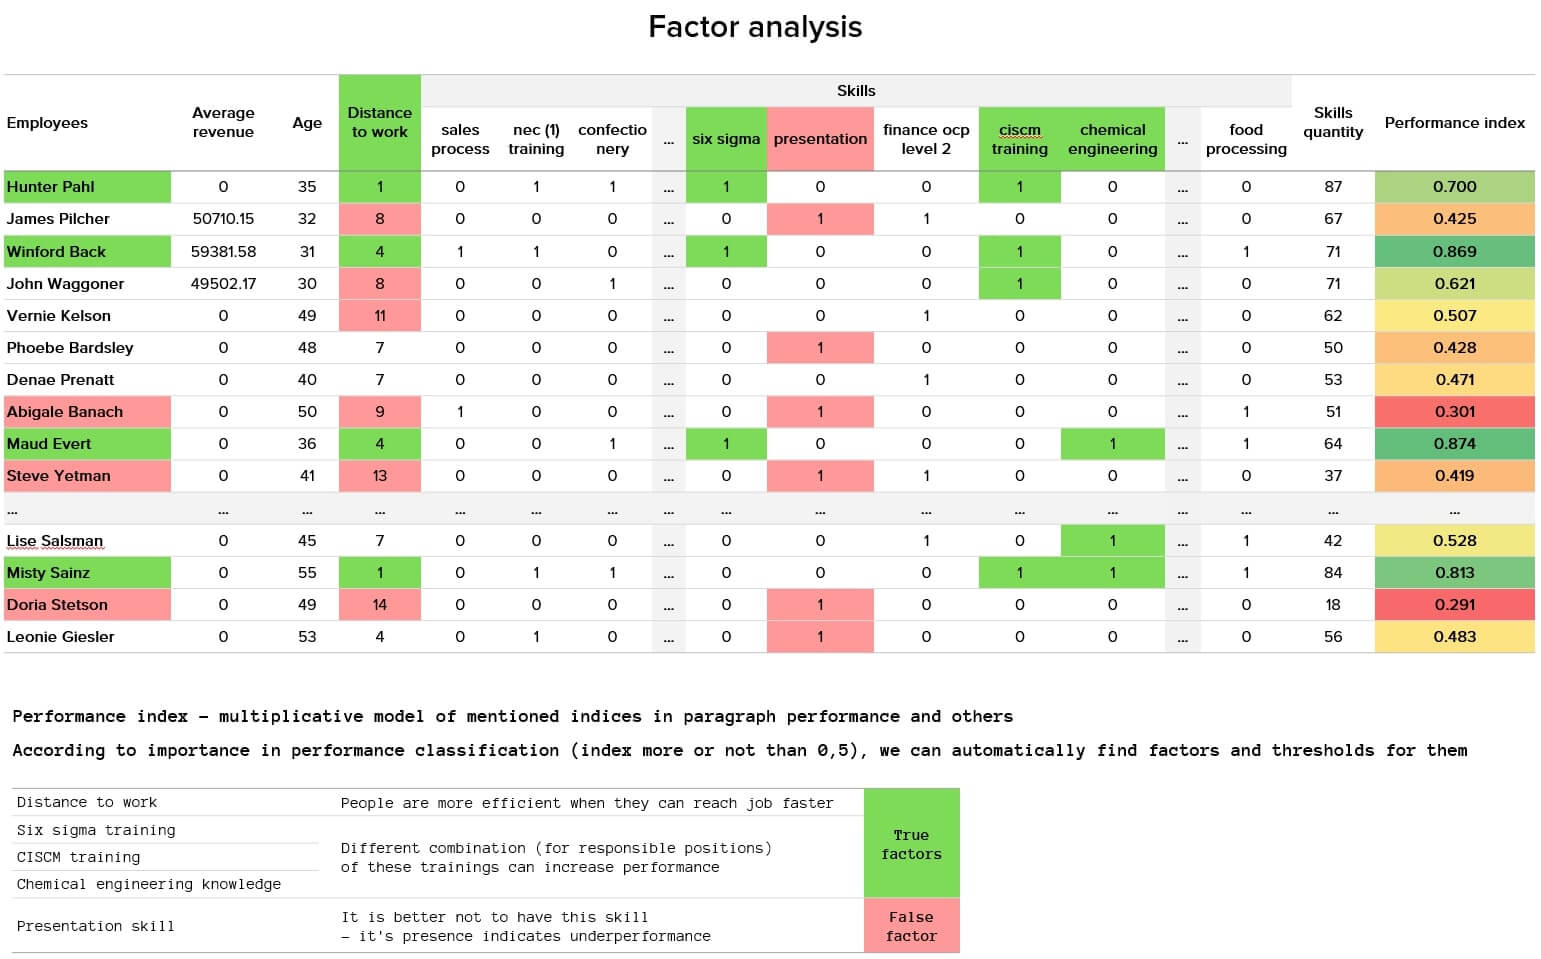
Speaking about the factor analysis and the changes in organization or department, caused by the changes of certain employee factors, traditional approaches are not always able to provide evident results and domain solutions. For example, a particular feature may be a characteristic only for those people who are under-performers. Having performed a further factor analysis, we can state that employees should not possess this specific feature. And those who actually do not have it would belong to the class of over-performers. Let’s assume that the feature we are talking about is, for example, the ‘corporate finance training'. We can understand the illogicality of this conclusion from the factor analysis. These kinds of conclusions will be frequent, if the specific sample is not representative in terms of the general sample, e.g. the whole company through the years of its operation or even a part of the market. The same is about data completeness, or other cases when a number of selected features is not sufficient.
As shown on the above table, the conducted factor analysis revealed that the employees with high efficiency (higher performance index) usually have three specific skills and live close to work (the green highlighted area). At the same time, we found out that the presence of certain features (e.g. presentation) is relevant only for under-performers. This pattern is false as the sample was probably unrepresentative or we did not manage to detect other features characterizing under-performers. Therefore, the traditional approach to factor analysis (MANOVA/LDA/PCA, feature importance from fitted estimator) requires expert validation. Otherwise, the results of the analysis will not be accurate and representative (any employees with the skill “presentation” should not be hired).
Conclusions
As you can see from the above research overview, machine learning methods combined with descriptive analysis can be beneficial for organizations in terms of human resources management. This complex approach can facilitate the process of personnel evaluation, as well as help optimize the employee evaluation structure. Organizations can reduce labor expenses as well as eliminate the need of manual processing required to cover a great amount of paper reports or questionnaires.
Together with financial planning, predictive analysis will help plan the changes that concern a company’s personnel. Provided that the relevant external data is available, the comparative analysis can be extended to identify skills gaps and solve the problems of cold starts, when an employee is in the hiring stage, or there is a need to analyze and evaluate a candidate's CV.
If you are looking for ways to facilitate your workforce analytics and improve talent-related decision-making, our data science experts will be happy to answer your questions. Get in touch with our team.
Related Insights


The breadth of knowledge and understanding that ELEKS has within its walls allows us to leverage that expertise to make superior deliverables for our customers. When you work with ELEKS, you are working with the top 1% of the aptitude and engineering excellence of the whole country.

Right from the start, we really liked ELEKS’ commitment and engagement. They came to us with their best people to try to understand our context, our business idea, and developed the first prototype with us. They were very professional and very customer oriented. I think, without ELEKS it probably would not have been possible to have such a successful product in such a short period of time.

ELEKS has been involved in the development of a number of our consumer-facing websites and mobile applications that allow our customers to easily track their shipments, get the information they need as well as stay in touch with us. We’ve appreciated the level of ELEKS’ expertise, responsiveness and attention to details.

